
Industries · Hospitality
Hospitality analytics that survives a busy Saturday.
Power BI and data analytics for UK hotels, restaurants, pubs and multi-site hospitality groups. Revenue, occupancy, labour, food cost, wet and dry margin, joined into one dashboard the operations team actually uses.
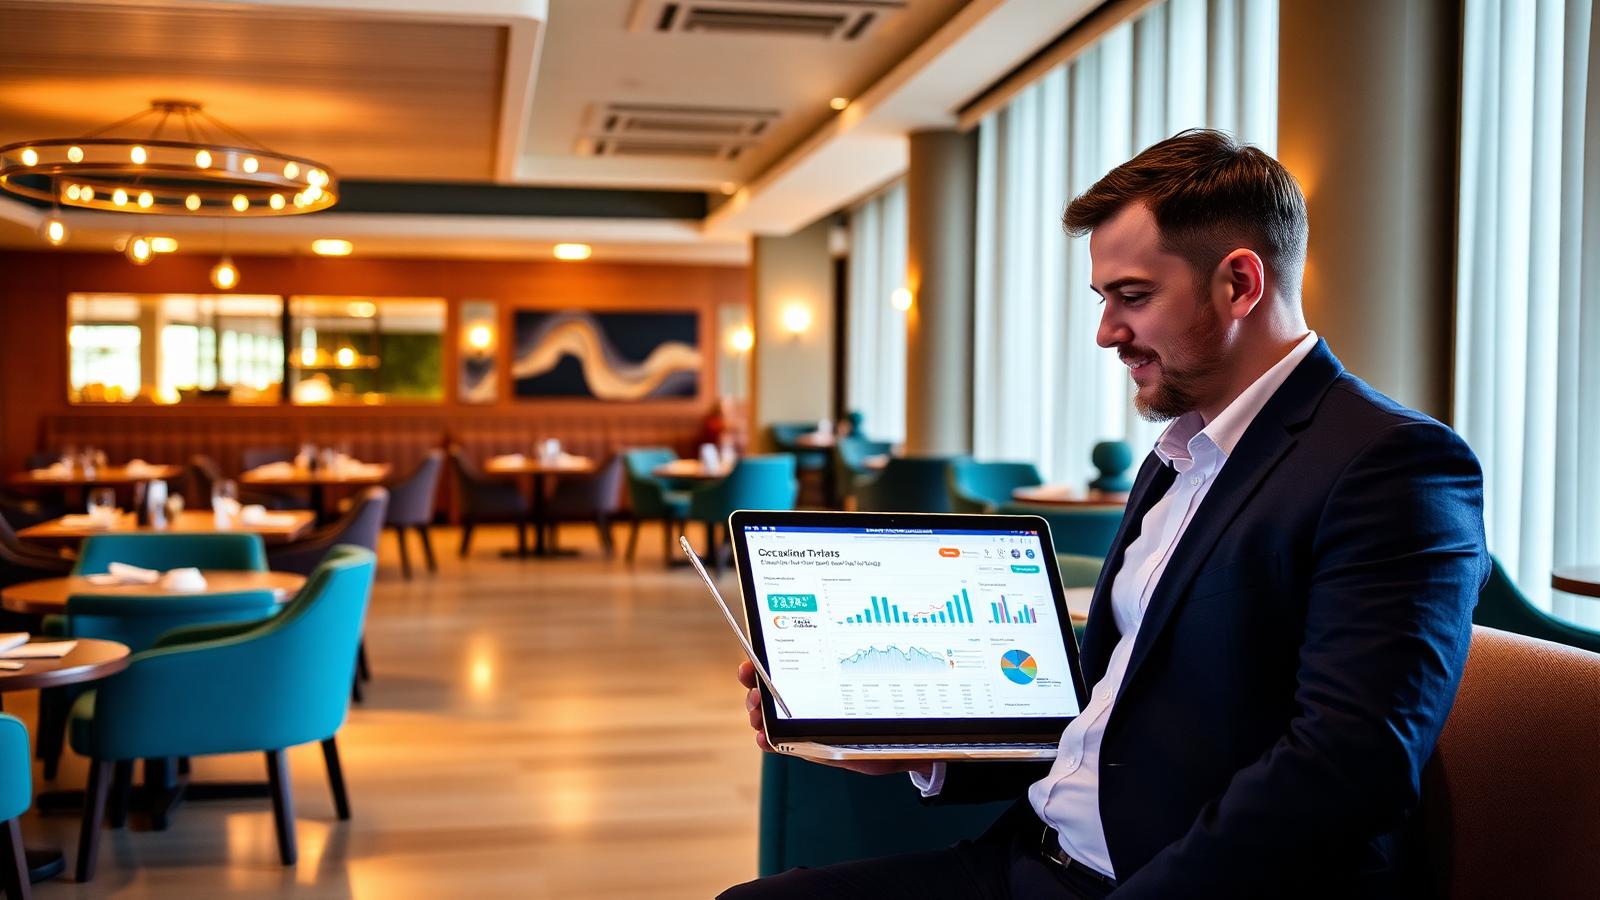
Hospitality is one of the toughest industries to run on gut feel. Margins are thin, labour is the biggest controllable cost, energy has become the second, food inflation is unpredictable, and the trading pattern moves week to week. Our hospitality analytics work is designed for operators that need a proper handle on all of that, without asking general managers to become data analysts on top of everything else they already do.
The metrics hospitality actually runs on
For hotels, the core numbers are occupancy, ADR, RevPAR, TrevPAR, GOPPAR and channel mix, split by segment and length of stay. For food and beverage, the numbers are wet and dry mix, average spend per cover, covers per hour, food cost percentage, GP by menu category, waste and staff meals. For labour, it is productivity per available room, covers per labour hour, and rota versus actual against forecasted demand.
Underneath those sit the daily flash numbers most operators already look at — sales, covers, wet and dry split, labour percentage, comps and voids — but joined into a trend rather than a single snapshot, and rolled up across sites so heads of operations can see the shape of the estate at a glance.
Where hospitality data usually lives
EPOS on the tills, from Oracle Simphony, Zonal, Tissl, NCR Aloha, Toast, Lightspeed or a bespoke stack. Property management in Opera, Mews or Guestline for hotels. Rotas in Fourth, Harri, RotaCloud, Bizimply or Deputy. Finance in Sage, Xero, Business Central or NetSuite. Stock in Fourth, Marketman or a bespoke tool. Reservations in ResDiary, SevenRooms, DesignMyNight or OpenTable. Group operators tend to have several EPOS platforms across a mixed estate, which is where reporting usually starts to fall apart.
Our default pattern is a small Microsoft Fabric or Azure warehouse that consolidates nightly extracts from every system, on a conformed site, product and time dimension. The reporting layer sits in Power BI and everyone — from GMs to the CEO — works off the same numbers with different levels of detail.
Labour, the biggest lever
Labour is where most hospitality operators recover the cost of an analytics platform in the first year. Forecast versus actual covers, forecast versus actual sales, rota versus worked hours and productivity by half-hour band on a single dashboard let operations teams tune rotas properly instead of trimming after the fact. In a group with fifty sites, the difference between well-tuned rotas and average rotas is often the difference between a good year and a bad one.
Menu and food cost analytics
Menu engineering is another area where good data pays quickly. A proper dashboard shows every dish by margin and popularity, flags stars, plough horses, puzzles and dogs, and gives head chefs the information they need to redesign the menu twice a year on evidence rather than instinct. Layered onto a stock and purchasing feed, the same platform supports theoretical versus actual GP, waste and yield.
Hotels, pubs, restaurants and groups
Independent hotels usually want a clean RevPAR and profit picture across segments and channels, joined to labour and F&B. Managed pub groups want site P&L, wet-dry mix and labour productivity across a large estate. Casual dining groups want cover flow, product mix and labour deployment. Serviced apartments, holiday parks and hostels sit somewhere between hotel and multi-site retail analytics. Every one of those business models works on the same underlying data platform — the differences are in the dashboards on top.
Related reading
Our guide to how data analytics helps a business covers the wider ROI conversation, and the supply chain analytics guide covers the stock, purchasing and waste side in depth.
Get started