Of all the corporate functions, human resource teams sit on the richest seam of operational data and tend to do the least with it. Payroll, applicant tracking, HRIS, learning platforms, engagement surveys, time and attendance, exit interviews, performance reviews; the people data exists, usually in a handful of disconnected systems, and almost always under used. Done well, HR reporting and analytics turns that raw material into a genuine strategic contribution: better hires, lower turnover, sharper workforce planning, and decisions that hold up when the finance director starts asking questions.
This guide walks through what HR reporting and analytics actually looks like in a UK mid market business, the HR metrics that earn their place on a dashboard, the people analytics use cases that pay back fastest, and the practical steps to get from spreadsheet driven reporting to a data driven HR function.
The difference between HR reporting and HR analytics
These two terms get used interchangeably and they should not. HR reporting is the descriptive layer. It answers questions about what happened: headcount by department, turnover rate last quarter, time to fill for open roles, absence by team, training hours completed, gender pay gap figures for the regulator. An effective HR report tells the leadership team what is going on across the workforce in a way that is timely, accurate and easy to read.
HR analytics, sometimes called people analytics, goes further. It explains why those things happened, predicts what is likely to happen next, and recommends what to do about it. Why is turnover in the field sales team running at twice the company average? Which candidates from which sources go on to become high performers? Which managers are most strongly associated with team engagement scores rising or falling? Reporting describes the workforce. Analytics helps the HR department change it.
Both matter, and both depend on the same foundation: clean, joined up HR data and analytics software that the HR function can actually use without escalating every question to IT.
The HR metrics worth tracking
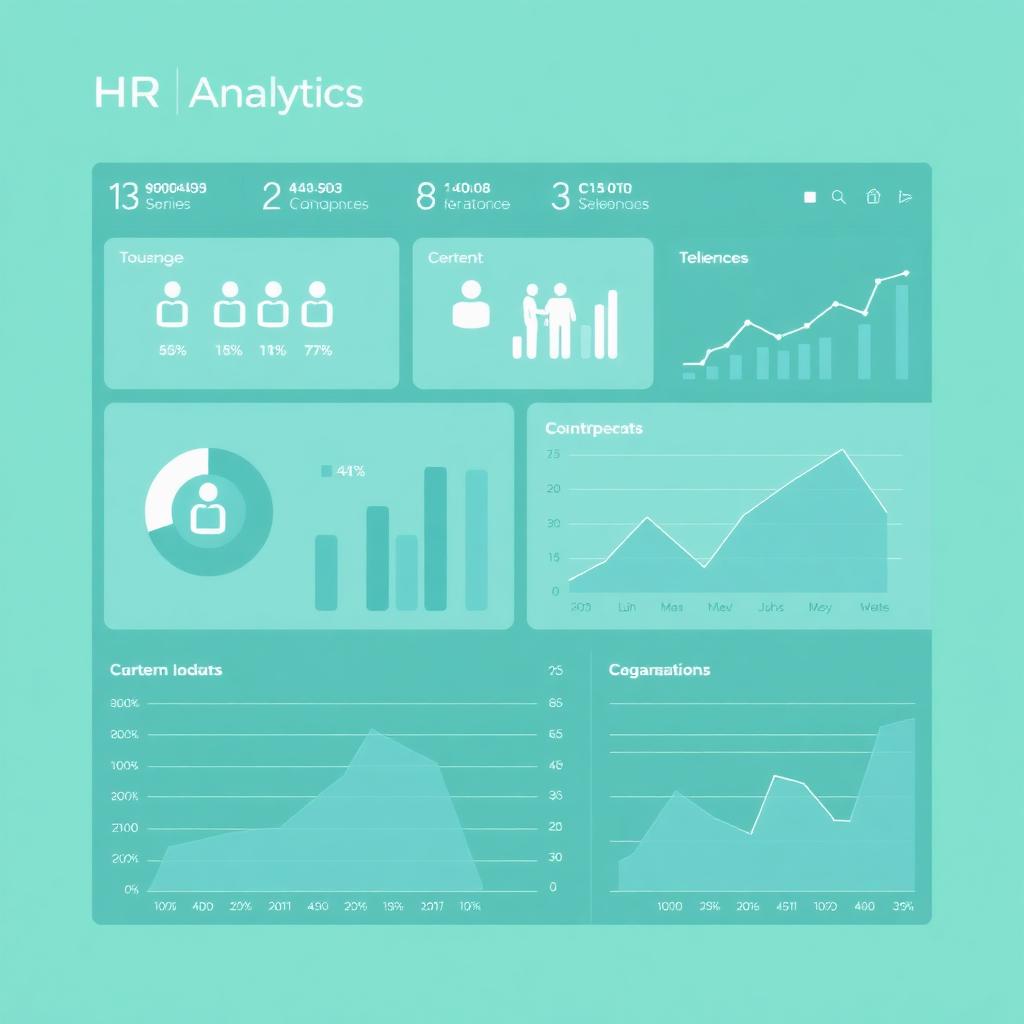
A common failure mode is the 80 metric dashboard nobody reads. A good HR reporting pack covers a small number of metrics across four areas, with the ability to drill into the detail when something looks off.
Workforce shape. Headcount and full time equivalents by department, location and contract type. Span of control by manager. Demographic breakdowns where legally appropriate. These metrics anchor every other conversation about cost, capacity and risk.
Talent acquisition. Time to fill, time to hire, cost per hire, offer acceptance rate, source of hire quality, and the conversion rate at each stage of the recruitment funnel. Time to fill in particular is a leading indicator of capacity pressure across the business, and one of the easiest metrics to get wrong if the applicant tracking system is not configured consistently.
Retention and engagement. Turnover rate, regretted turnover rate, tenure curves, internal mobility rate, engagement survey scores and participation rates, absence rate. Tracking voluntary and involuntary turnover separately matters; a 15% turnover rate driven mostly by performance exits tells a very different story to one driven by resignations from high performers.
Performance and development. Distribution of performance ratings, promotion rate, training hours per head, completion rates for mandatory training, and the proportion of roles with a documented succession plan. These metrics turn vague conversations about culture and capability into something measurable.
Collecting data without losing your mind
The bottleneck in most HR analytics programmes is not modelling or visualisation. It is collecting data from the systems that already hold it. A typical UK mid market HR stack might include a core HRIS, a separate payroll platform, an applicant tracking system, a learning management system, an engagement survey tool, and a timesheet or rota application. Each one holds part of the employee record and almost none of them speak fluently to the others.
The pragmatic answer is to land data from each of those systems into a single warehouse or lakehouse, on a schedule, with a clean employee identifier joining everything together. Microsoft Fabric and Azure SQL are both sensible homes for this in a Microsoft shop, and the HR analytics layer then sits in Power BI on top. This is the same architecture we recommend for most data work in our data strategy guide, and HR is one of the functions where it pays back fastest, because the source systems are reasonably stable and the questions are reasonably consistent year to year.
What an effective HR report actually looks like
An effective HR report does three things at once. It gives the executive team a one page view of workforce health against a small number of agreed metrics. It lets HR business partners self serve into the detail for their part of the business without raising a ticket. And it flags exceptions automatically, so a turnover spike or a time to fill blowout shows up the week it happens rather than the month after.
In practice this is usually three or four Power BI dashboards, not one giant page: a workforce overview, a talent acquisition view, a retention and engagement view, and a learning and performance view. Each one is built on the same underlying people data model, so a headcount number means the same thing on every page. The detail behind the numbers should always be one or two clicks away, not buried in a separate spreadsheet someone in HR operations refreshes by hand on a Friday.
People analytics use cases that earn their keep
Once HR reporting is solid, people analytics becomes possible. The use cases that consistently pay back for UK mid market businesses tend to be unglamorous and operational rather than headline grabbing AI projects.
Predicting and reducing turnover. By combining tenure, role, manager, engagement scores, absence patterns and pay position, a relatively simple model can flag flight risk well before someone resigns. The value is not in the model itself but in giving HR and line managers enough warning to have a useful conversation. Even modest improvements in regretted turnover at senior levels pay for the entire analytics programme several times over.
Identifying issues in the hiring funnel. Drop off between application and offer is rarely uniform across roles, sources or recruiters. Funnel analytics often reveals that one source produces a high volume of candidates with a tiny conversion rate, or that one stage in the process is killing time to fill without improving quality. Fixing those specific bottlenecks tends to outperform any amount of generic recruitment process improvement.
Quality of hire over time. By joining applicant tracking data to performance and retention data twelve to twenty four months later, HR can finally see which sources, assessment methods and interviewers produce people who actually succeed in the business. Almost every business has a recruitment channel it spends money on out of habit that the data does not justify.
Engagement that goes beyond the survey. Engagement survey scores are useful but lagging. People analytics combines them with operational signals such as absence, attrition, internal mobility and training uptake to produce a richer view of employee engagement by team and manager. That richer view is what lets the HR function support managers in a targeted way rather than broadcasting generic advice.
Workforce planning that survives contact with reality. Combining headcount, turnover, hiring lead times and business demand forecasts produces a workforce plan that actually predicts when capacity gaps will hit. This is the single biggest opportunity for HR to add strategic value, because it turns workforce planning from a once a year budget exercise into a rolling, evidence based conversation with the rest of the leadership team.
How HR teams build the capability
Capability in HR reporting and analytics is built in layers. The first layer is a small group inside the HR team comfortable with Power BI and the underlying data model, who can build reports, answer ad hoc questions and translate between HR business partners and the data platform team. The second layer is the broader HR function being able to read, interrogate and act on the reports, which usually needs structured training rather than hoping people pick it up.
Most HR teams we work with do not need a full time data scientist. They need one or two analytically minded HR professionals with proper Power BI skills, a clean data platform behind them, and senior sponsorship to make sure the work actually changes decisions. Our Power BI training is regularly delivered to HR teams for exactly this reason.
Governance, ethics and the obvious risks
People data is sensitive in a way that sales or operational data is not. An HR analytics programme has to be built on a clear governance model: who can see what, at what level of aggregation, with what retention and audit. Predictive models that touch individuals, particularly anything that influences hiring, promotion or exit decisions, need active scrutiny for bias and legal compliance.
The good news is that the same data platform discipline that makes HR analytics work also makes governance easier to enforce. Centralising people data in one warehouse, with row level security and proper access controls in Power BI, is far safer than the alternative of spreadsheets emailed around the business.
Tying it back to decisions
The whole point of HR reporting and analytics is to inform decisions. Hire here, not there. Invest in this manager. Restructure that team. Adjust pay in this function before turnover gets worse. A data driven HR function is one where those decisions are made with evidence on the table rather than instinct, and where the outcomes are tracked afterwards to see whether the call was right.
Businesses that get this right find that HR moves from being a cost centre that produces compliance reports to being a genuine partner in commercial decision making. The technology required is modest. The data is mostly already there. The work is in joining it up, presenting it well, and building the muscle in the HR function to act on what it shows.
For a broader view of how reporting and analytics drives decisions across the business, our companion piece on how business intelligence helps in decision making covers the same ideas applied to finance, operations and customer functions.
Frequently asked questions
What is the difference between HR reporting and HR analytics?
HR reporting describes what is happening in the workforce, such as headcount, turnover rate and time to fill. HR analytics goes further and explains why, predicts what is likely to happen next, and recommends actions. Reporting is the foundation; analytics is what you build on top.
Which HR metrics should we start with?
Headcount and FTE, turnover rate split between voluntary and involuntary, time to fill, absence rate and engagement survey scores cover the majority of executive questions. Add quality of hire and internal mobility once the basics are reliable.
Do we need specialist HR analytics software?
Usually not. Most UK mid market HR teams get further by landing data from their existing HRIS, ATS and payroll into a warehouse and using Power BI on top, rather than buying a dedicated people analytics platform that still needs the same data work underneath.
How long does an HR analytics programme take to deliver value?
A first version of joined up HR reporting in Power BI is achievable in 8 to 12 weeks for most mid market businesses. Predictive use cases such as turnover risk typically follow in the next 3 to 6 months once the underlying data is trusted.
Want to talk this through with someone?
We are an independent UK Power BI and Microsoft Fabric consultancy. Honest opinions, fair prices, no sales pressure.